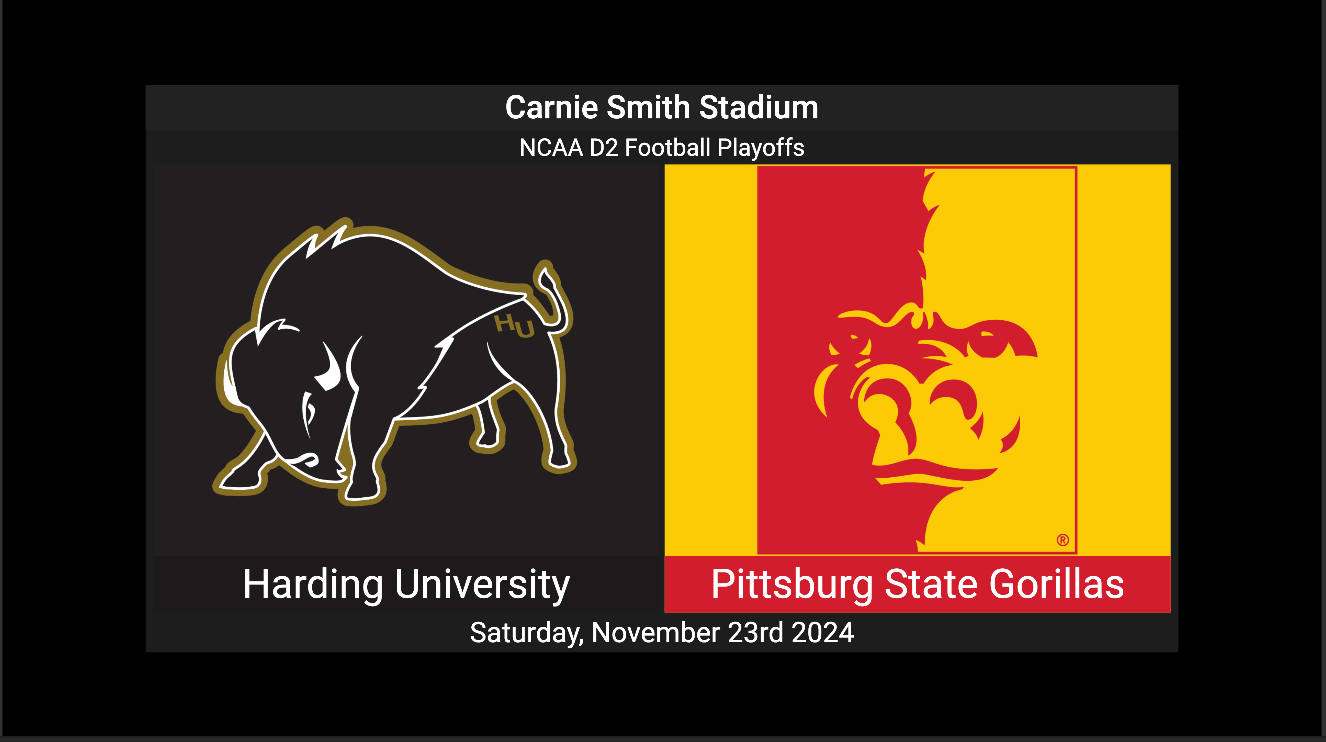
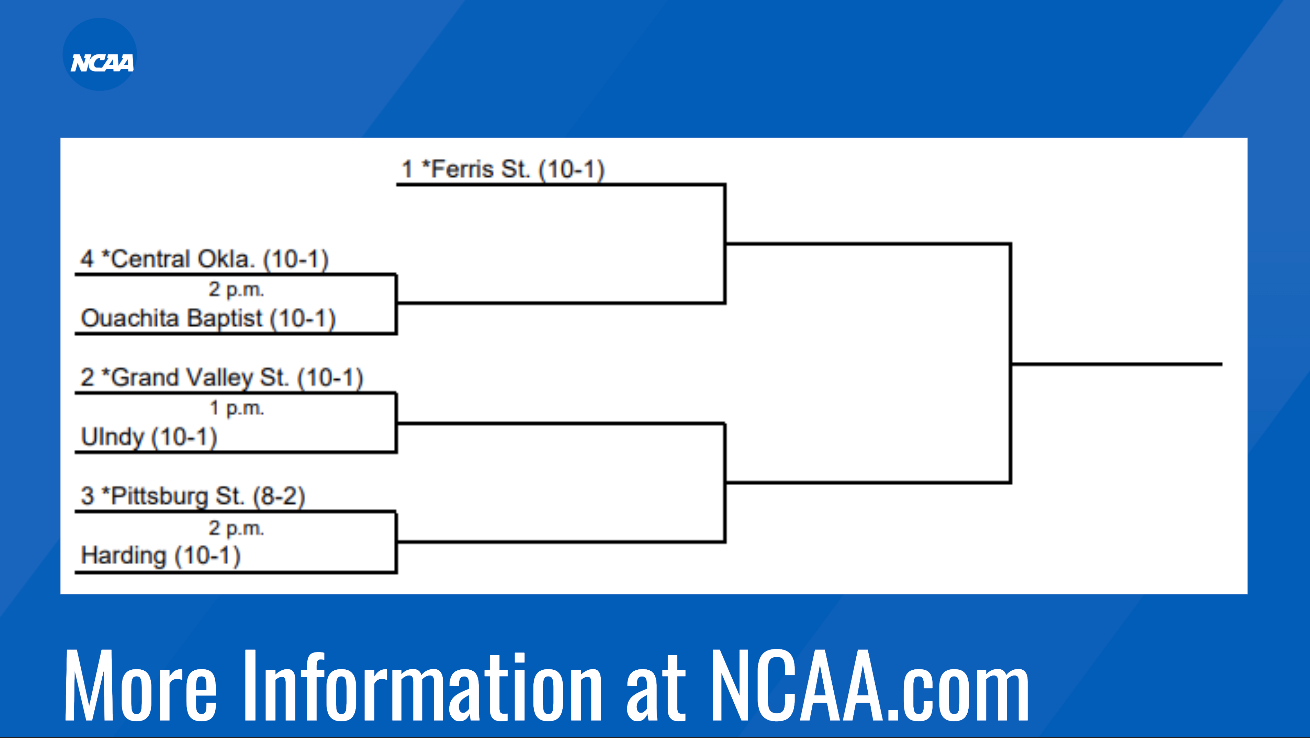
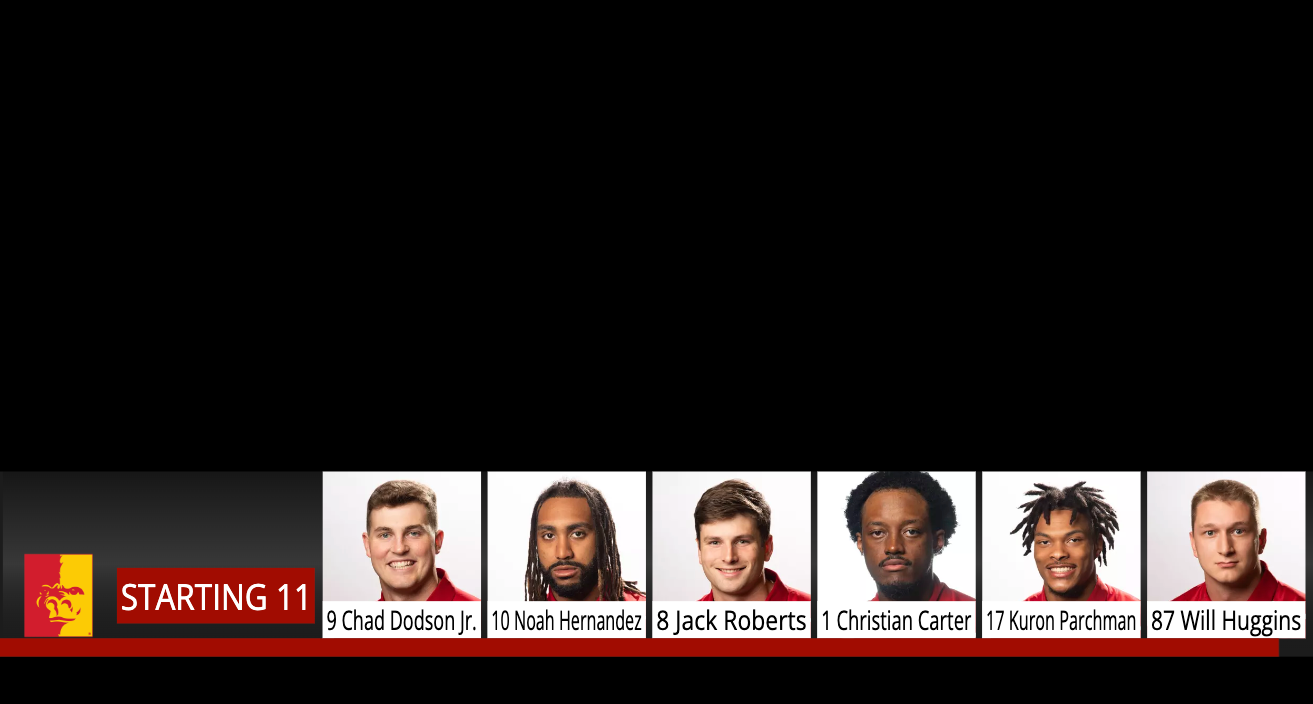
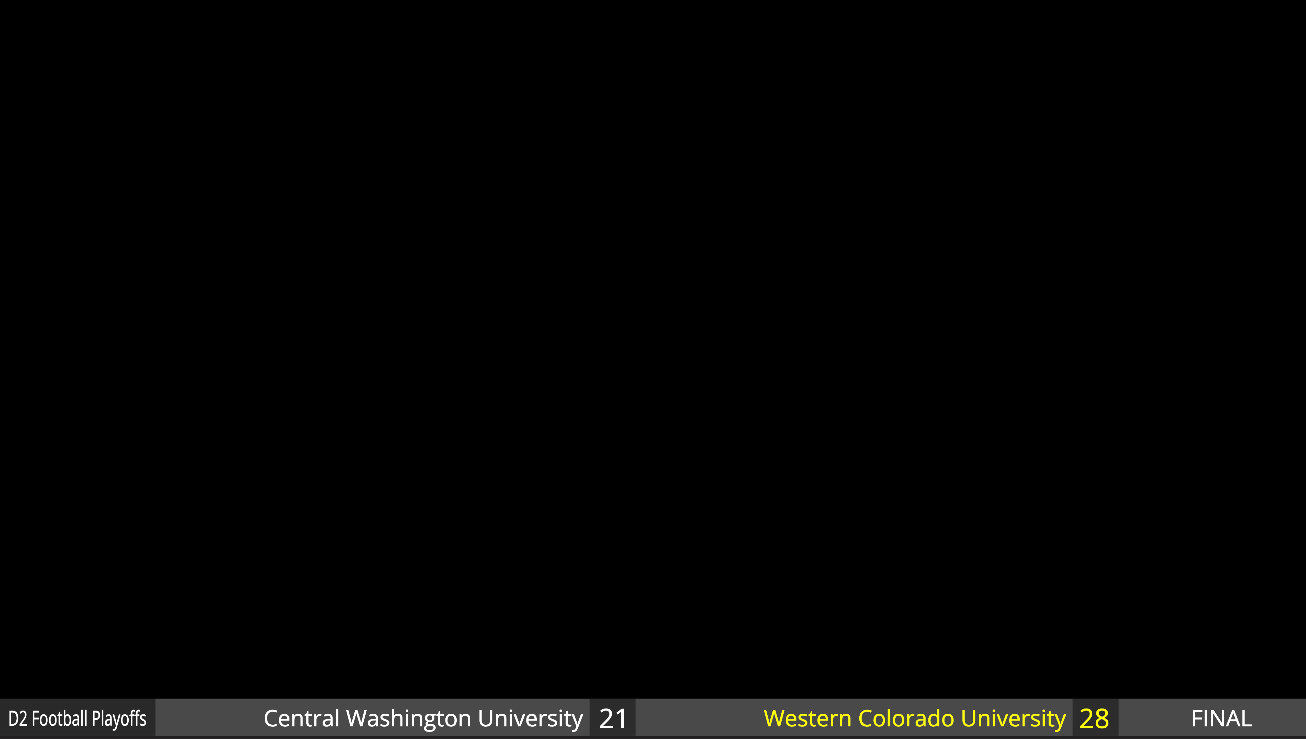
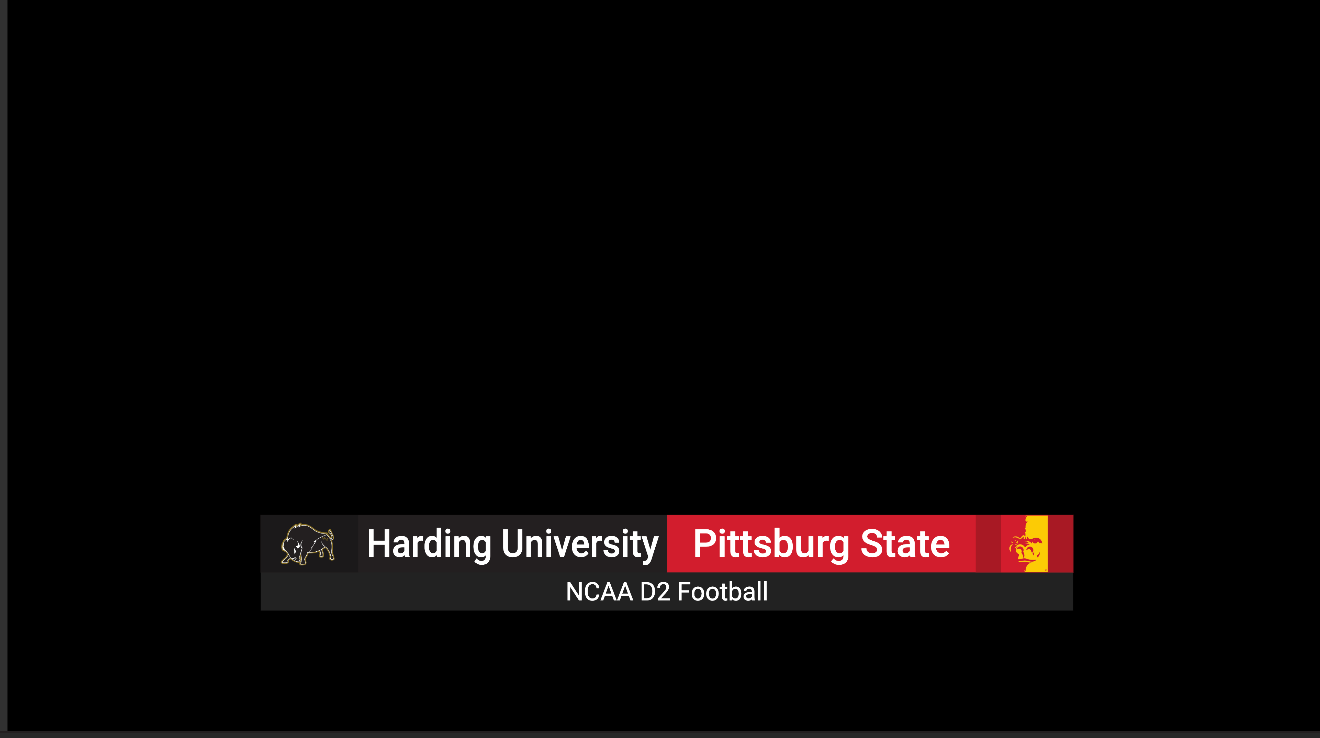
Throughout my time working on Pittsburg State University sports broadcasts, I have continue to push the standards for live streams higher by implementing new graphics, organization practices, and other tools to aid workers and administrative personnel. For example, I introduced Singular.live graphics to the broadcasts in 2022. This allowed the live streams to include animated graphics for weather, lower thirds, and matchup statistics. And, I independently developed a ticker graphic that automatically pulls data from NCAA.com and displays current scores for matches chosen in advance.
Broadcast Graphics Examples:



Using the open-source project "OnTime", I have developed rundowns for various broadcasts. these rundowns allow me to better organize time-sensitive sections of a show like pre/post-game segments. The software allows me to create the rundowns on my laptop and easily upload them to broadcast computers for ease of use. These rundowns are also shared via local websites so talent, directors, and camera operators can understand what is happening during a show.
Sports Broadcasting Rundown Example: